
Declarative, pipeable survey weighting in base R: from design weights to calibrated, model-assisted, variance-ready weights.
weightflow builds survey weights by chaining hierarchical adjustments with a tidymodels-style API, and estimates their variances with a bootstrap that re-applies the whole recipe on each replicate. For continuous surveys it carries the same idea across time: rotating panels, longitudinal weights, and the variance of a net change with the sample overlap entering as covariance. It has no hard dependencies (base R, R >= 4.1) and bridges to survey/srvyr for design-based inference.
Get it from CRAN —
install.packages("weightflow")— or read the full documentation at the project website. Free and open source (MIT).
Where does it fit? survey and srvyr are the standard tools for analysing data once you already have weights. weightflow sits one step earlier: it builds those weights from the design base weights, making every adjustment (eligibility, nonresponse, calibration, trimming) an explicit, auditable step, and then hands the result to survey/srvyr for inference.
What makes weightflow different
- A weighting recipe, not a black box. The whole process (eligibility, selection, nonresponse, calibration, trimming) is one explicit, auditable, pipeable object that you read top to bottom.
- Flexible engines for nonresponse and outcome models. Response propensities and model-calibration outcomes can be fitted with logistic regression, CART, random forest or gradient boosting (xgboost): same API, swap one argument.
- Cross-fitting to tame overfitting. Flexible learners can overfit the propensity and blow up the weights; optional k-fold cross-fitting estimates each unit out-of-sample, with folds formed by cluster so there is no leakage.
- Calibration that controls extreme weights. Beyond raking, post-stratification and GREG, ridge (penalized) calibration relaxes the targets to keep weights stable when there are many auxiliaries.
- Principled trimming. The usual far-out fence, plus Potter’s MSE-optimal cutoff, chosen from the data instead of by hand.
- Trimmed calibration that keeps the totals. Bound the weights into a fixed range as a range-restricted re-calibration, so trimming no longer breaks the calibration you just did (unlike cap-and-redistribute).
-
Recipe-aware variance. The bootstrap and jackknife re-apply every step on each replicate, so the standard errors carry the variability of the whole cascade, with lonely-PSU handling and parallel
cores. - A full methodological quality report. One call writes a self-contained, bilingual (EN/ES) HTML report: the cascade in prose, AAPOR fieldwork rates, per-domain reliability, the replication design, a per-step impact table and a points-of-attention panel.
-
Calibrate to a reference survey, not only a frame.
reference_sample()targets the design-weighted totals of a larger survey you trust (the official ECH, a labour force survey), and the bootstrap propagates the variance of those estimated totals when you pass its replicate weights. - Panels, and the variance of a change. Rotating and pure panels are first-class: the replicates are coordinated across waves, so a PSU in both periods is resampled the same way in both and the overlap shows up as covariance, which is what makes a net change more precise than the two levels it is built from. Plus longitudinal weights, attrition, gross flows and composite (CRE) estimation.
-
Chained production, one period at a time. An office publishes month
tbefore montht+1exists.wave_step()runs a single period and hands the next one a small carry; the chain never needs the earlier waves in memory. - Non-probability samples, and how far to trust them. Pseudo-weights against a probability reference, Meng’s data-defect index, and a pattern-mixture sensitivity analysis that says how far nonignorable nonresponse could move the answer – instead of assuming it cannot.
-
Programmatic quality control. Every step carries a stable
id, every quality incident lands inweighting_alerts(), andcollect_step_detail(),collect_propensities()anddomain_summary()audit the cascade unit by unit and domain by domain, from a script or in the HTML report. A recipe is also a file:write_recipe()/read_recipe()round-trip it as YAML.
How it works
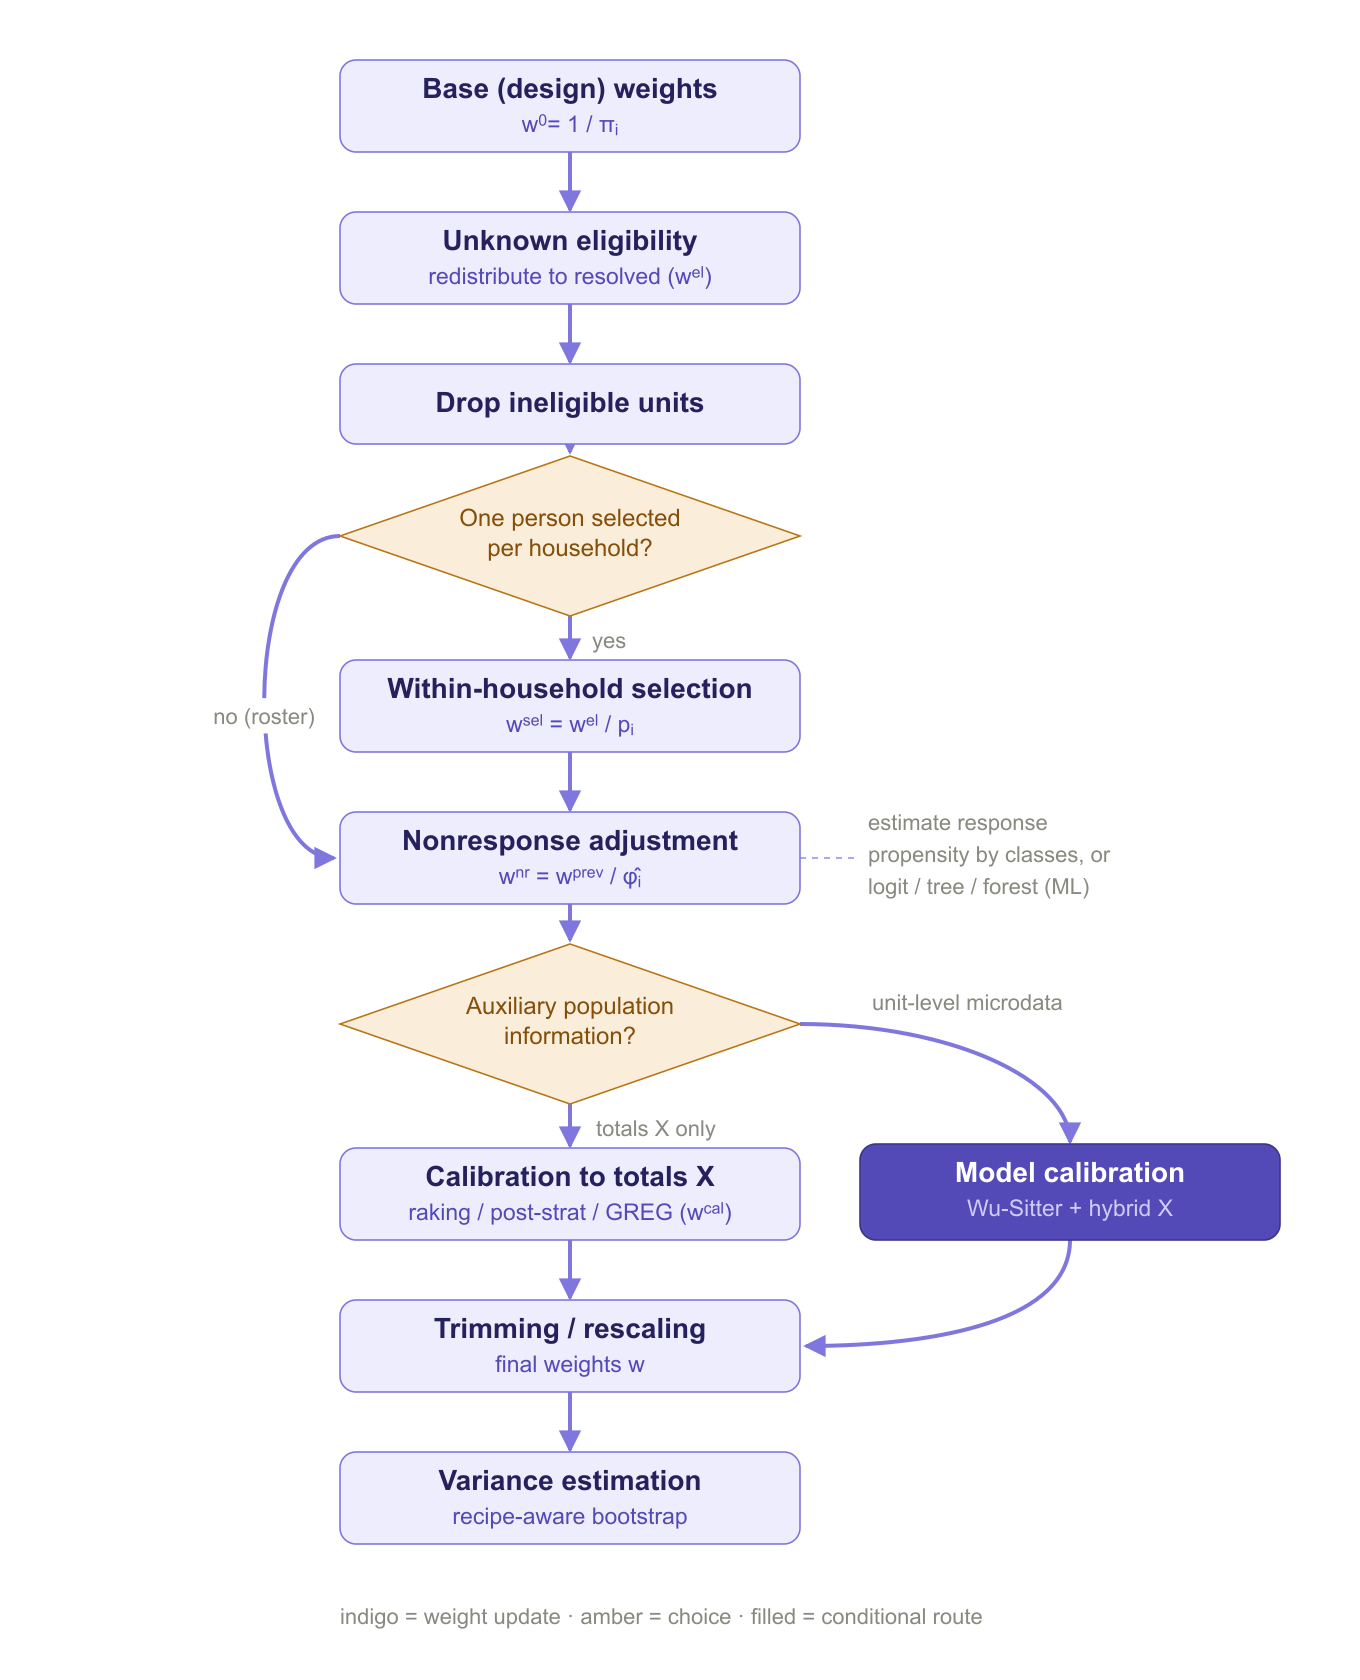
weightflow expresses the whole weighting process as a sequence of explicit steps. The diagram below summarizes the flow and the choices that depend on the design and on the available auxiliary information.
Installation
# From CRAN
install.packages("weightflow")

# Development version (latest changes)
# install.packages("remotes")
remotes::install_github("jpferreira33/weightflow")
The idea
A recipe is inert: building it computes nothing. prep() walks the steps in order and estimates the cascade of factors; collect_weights() extracts the final weights. Separating define from apply makes the whole process reproducible and auditable, and it is exactly what lets the bootstrap re-run the entire cascade per replicate.
library(weightflow)

recipe <- weighting_spec(sample_one, base_weights = pw) |>
  step_unknown_eligibility(unknown = unknown_elig, by = "region") |>
  step_drop_ineligible(ineligible = ineligible) |>
  # household nonresponse: the whole dwelling is lost (no roster), so the
  # adjustment is at the household level and uses only frame information
  step_nonresponse(respondent = hh_responded, method = "weighting_class",
                   by = "region", cluster = "household_id") |>
  step_select_within(prob = p_within) |>
  # person nonresponse: among the selected persons, the roster gives sex and age
  # even for those who did not respond, so a propensity model can use them
  step_nonresponse(respondent = responded, method = "propensity",
                   formula = ~ region + sex + age, engine = "logit",
                   num_classes = 10) |>
  step_calibrate(method = "raking",
                 margins = list(region = c(table(population$region)),
                                sex    = c(table(population$sex)))) |>
  step_trim_weights() |>
  step_assert(max_deff = 3)

fitted <- prep(recipe)              # estimate the cascade
summary(fitted)                     # per-stage diagnostics + Kish deff
wts    <- collect_weights(fitted)   # data.frame with .weight
A worked example on real data
The article A full weighting pipeline on a real household survey (ECH 2019) runs the whole workflow on open microdata from Uruguay’s continuous household survey: it induces realistic eligibility and nonresponse, weights the survivors back with integrated household calibration, validates the poverty-rate estimate against a known truth, and attaches design-based confidence intervals with the bootstrap.
Highlights
The methods below are what set weightflow apart. Each is opt-in: the defaults reproduce classic survey weighting, and one argument switches the method on.
Machine-learning propensities
Estimate the response propensity with a machine-learning learner instead of logistic regression, useful when nonresponse depends on the covariates in nonlinear or interacting ways. Four engines behind the same API, swap one argument: "logit" (logistic regression, base R), "tree" (CART, via rpart), "forest" (random forest, via ranger) and "boost" (gradient boosting, via xgboost). The same engines drive the outcome models in step_model_calibration(). By default the propensity model is fit with the incoming weights; set weight_model = FALSE to fit it unweighted, useful when the weights are unrelated to response given the covariates (Little & Vartivarian 2003).
step_nonresponse(respondent = responded, method = "propensity",
                 formula = ~ region + sex + age, engine = "forest")
Cross-fitting (k-fold)
A flexible learner that predicts the same units it trained on overfits the propensity, which inflates the weights and the variance. Cross-fitting estimates each unit from a model trained on the other folds; folds are formed by cluster when a cluster is set, so household members never leak across folds.
step_nonresponse(respondent = responded, method = "propensity",
                 formula = ~ region + sex + age, engine = "boost",
                 crossfit = 5, crossfit_seed = 1)
In practice this is the difference between a stable adjustment and one dominated by a few extreme weights: on the bundled data, boosting without cross-fitting inflates the design effect, while cross-fitting brings it back down (the Machine learning, cross-fitting and robust calibration article shows the two side by side).
Nonresponse by calibration (two-phase)
Adjust for nonresponse by calibrating the respondents to auxiliary totals instead of weighting classes or inverse propensities. With totals = NULL it reproduces the pre-nonresponse cascade estimates exactly (the two-phase case); pass population totals to calibrate the respondents to external control totals instead.
step_nonresponse(respondent = responded, method = "calibration",
                 formula = ~ region + sex)
Ridge (penalized) calibration
When you calibrate to many margins, forcing every constraint exactly can produce extreme weights. Ridge calibration relaxes the targets in a controlled way: a single, scale-free penalty trades a little accuracy on the totals for much steadier weights.
step_calibrate(method = "linear", formula = ~ region + sex,
               totals = pop_totals, penalty = 1)   # smaller = more relaxation
Potter (MSE-optimal) trimming
Instead of a hand-picked cutoff, choose the trimming threshold that minimizes an estimate of bias^2 + variance (Potter 1990), balancing the bias of trimming against the variance from extreme weights.
step_trim_weights(method = "potter")Trimmed calibration that preserves the totals
step_trim_weights() caps and redistributes, which quietly breaks the calibration you just did. step_trim_calibrated() instead pulls the weights into [lower, upper] as a bounded re-calibration (the generalized exponential method of Folsom & Singh), so every calibration total is still met after trimming. Bounds can differ by subgroup (by), and there is an integrative (one factor per household) variant.
step_trim_calibrated(~ region + sex, lower = 20, upper = 400)Tidy calibration totals
Hand weightflow the population totals the way they actually arrive, as a data frame (a census cross-tab, a projection, a spreadsheet), instead of a fiddly model-matrix vector. Name the counts column with count; several category columns are crossed automatically, and weightflow builds the intercept and the dropped reference levels for you.
region_sex <- as.data.frame(table(region = population$region, sex = population$sex))
step_calibrate(method = "poststratify", totals = region_sex, count = "Freq")
When several margins disagree on the population total (a common rounding artifact of independently produced control totals), weightflow reconciles them to a common N and reports the adjustment, instead of failing or silently picking one.
Domain (partitioned) calibration
Calibrate independently within each domain, each to its own totals, with one argument (by). The domain is just a column in the tidy totals, not a term in the formula, and it composes with calfun, bounds, penalty and the integrative cluster option.
It earns its keep with a quantitative control total that differs by domain, awkward to express by hand, since it needs domain-by-covariate interactions. Here each region is calibrated to its sex counts and to its own income total:
sex_by_region    <- as.data.frame(table(region = population$region, sex = population$sex))
income_by_region <- aggregate(income ~ region, population, sum)   # region -> income total

step_calibrate(method = "linear", formula = ~ sex + income,
               totals = list(sex = sex_by_region, income = income_by_region),
               count = "Freq", by = "region", calfun = "raking")
Raking fits the case where, within each region, you know the margins separately (each region’s sex totals and its age-band totals, not their cross):
sex_by_region <- as.data.frame(table(region = population$region, sex     = population$sex))
age_by_region <- as.data.frame(table(region = population$region, age_grp = population$age_grp))

step_calibrate(method = "raking",
               totals = list(sex_by_region, age_by_region),
               count = "Freq", by = "region")
Exponential (raking) calibration distance
A calfun = "raking" distance (g = exp(u)) keeps the calibrated weights positive without explicit bounds while still hitting the targets exactly, on categorical and continuous auxiliaries alike, and with the integrative option.
step_calibrate(method = "linear", formula = ~ region + income,
               totals = list(region = m_region, income = 1.2e6),
               count = "Freq", calfun = "raking")
External consistency totals for model calibration
The control totals of the model-calibration auxiliaries often come from an outside source (an official figure, a variable not in the frame). Pass them through x_totals, in the same tidy shape as linear calibration; population is then used only for the model predictions.
step_model_calibration(
  x_formula  = ~ region + age,
  models     = list(income = y_model(income ~ age + sex, engine = "glm")),
  population  = population,
  x_totals   = list(region = m_region, age = 5.1e5), count = "Freq")
Calibrating to a reference survey
When you do not have census totals but you do have a larger survey you trust, reference_sample() calibrates to its design-weighted totals instead of a frame. Those targets are estimates, so pass the reference survey’s replicate weights to propagate their sampling variance through the bootstrap (only the bootstrap carries this component). A reference whose weights are all 1 reproduces the plain frame exactly.
step_calibrate(method = "raking", formula = ~ region + sex,
               population = reference_sample(ech, "w"))
See the Calibrating to a reference survey article.
Non-probability samples: pseudo-weights and the data-defect index
A volunteer panel, a web opt-in or an app sample has no design weights. step_pseudoweight() estimates the participation propensity against a probability reference survey (any engine, with cross-fitting) and turns it into a pseudo-weight; data_defect() then reports Meng’s data-defect correlation and the effective sample size it implies, which is the honest answer to “how large is this sample, really”.
fit <- weighting_spec(volunteers, base_weights = NULL, nonprob = TRUE) |>
  step_pseudoweight(reference = reference_sample(ech, "w"),
                    formula = ~ region + sex + age, engine = "forest") |>
  prep()
data_defect(fit)
See the Non-probability samples article.
How far nonignorable nonresponse could move the answer
Every nonresponse adjustment assumes the mechanism is ignorable given the auxiliaries. step_nr_sensitivity() does not adjust anything: it reduces the auxiliaries to a proxy and reports the proxy pattern-mixture ignorance interval (Andridge & Little 2011) over a grid of phi, from ignorable (phi = 0) to response depending on the outcome itself (phi = 1). Read it next to the sampling confidence interval, not instead of it. The same step covers participation in a non-probability sample.
fit <- spec |>
  step_nr_sensitivity(y = income, formula = ~ region + sex + age) |>
  prep()
nr_sensitivity(fit)
Two-phase subsampling, with its own variance component
When a subsample is drawn from the respondents for a follow-up module, step_subsample() records the second phase, the bootstrap switches to the two-phase resampling factor, and two_phase_variance() splits the result into the phase-1 and phase-2 components instead of reporting one opaque number.
spec <- weighting_spec(df, base_weights = pw) |>
  step_subsample(selected = in_phase2, prob = p2, psu = "household_id")
boot <- bootstrap_weights(spec, replicates = 500, strata = "region", psu = "psu")
two_phase_variance(boot, "income")      # V = V1 (phase 1) + V2 (phase 2)
See the Two-phase sampling article.
Recipe-aware bootstrap
The bootstrap resamples PSUs within strata (Rao-Wu rescaling) and re-applies the whole recipe on each replicate, so the replicate weights carry both the sampling design and every weighting adjustment at once. Single-PSU (“lonely”) strata are handled explicitly (lonely_psu = "certainty" or "collapse"), and the replicates can run in parallel with cores.
boot <- bootstrap_weights(spec, replicates = 500, strata = "region", psu = "psu",
                          lonely_psu = "collapse", cores = 4)   # collapse + parallel
boot_mean(boot, "income")           # estimate, SE and 95% CI
Recipe-aware jackknife
Alongside the bootstrap, a delete-a-PSU jackknife re-runs the whole recipe on each replicate, so the replicate weights carry every adjustment. Stratified (JKn) or unstratified (JK1), with the same lonely_psu handling and parallel cores, and it bridges to survey/srvyr for any estimand or domain.
jk <- jackknife_weights(spec, strata = "region", psu = "psu",
                        lonely_psu = "collapse", cores = 4)
jack_total(jk, "employed")
Finite-population correction and t / percentile intervals
bootstrap_weights(fpc = ) folds the first-stage sampling fraction into the Rao-Wu rescaling, which matters when strata are sampled at a high rate (common in LatAm designs). The estimate functions also carry the design degrees of freedom (df) and offer ci_type = "t" and, for the bootstrap, ci_type = "percentile".
boot <- bootstrap_weights(spec, replicates = 500, strata = "region", psu = "psu",
                          fpc = "samp_frac")
bootstrap_estimate(boot, function(w, d) sum(w * d$income), ci_type = "t")
Inspecting and auditing the cascade
Every step has a stable id (nonresponse_1, calibrate_1), so the cascade can be audited from a script: weighting_alerts() / has_alerts() as a quality gate, collect_step_detail(fit, "calibrate_1") and collect_propensities() unit by unit, and domain_summary() for per-domain reliability.
fit <- prep(recipe)
if (has_alerts(fit)) weighting_alerts(fit)
domain_summary(fit, by = "region")
See the Inspecting and auditing the cascade article.
A recipe is a file
write_recipe() serializes the recipe (never the data, never the weights) to YAML, and read_recipe() rebuilds it against new data, so the methodology of a production run lives in version control next to the code and can be diffed release to release. Reading is deliberately conservative: captured expressions are reconstructed, arbitrary code is not, unless you ask for it.
write_recipe(spec, "methodology/ech-2026q1.yml", timestamp = FALSE)
spec_q2 <- read_recipe("methodology/ech-2026q1.yml", data = ech_q2)
See the weightflow in production article.
Handing the weights on: disclosure risk and small-area inputs
disclosure_risk() flags publication cells where one unit carries an outlying share of the weight, which is where re-identification risk concentrates. as_sae_input() exports, per domain, the direct estimate, its recipe-aware design SE and the effective n, which is exactly what a Fay-Herriot model in emdi / sae / hbsae consumes. weightflow does not fit the small-area model; it hands over the design-based ingredients with a publishability rating attached.
disclosure_risk(fitted, by = "region")
as_sae_input(boot, "poor", by = c("region", "sex"), type = "mean")
R-indicators of response representativity
After a nonresponse adjustment, summary() and report_weighting() automatically report the R-indicator (Schouten, Cobben & Bethlehem) plus the partial R-indicators: how representative the response is, and which variable drives the gap. No new function to call.
# printed by summary() when the recipe adjusts for nonresponse:
# R-indicator (representativity of response): 0.890  (on region, sex)
A methodological quality report (HTML)
report_weighting() turns a fitted recipe into one self-contained, bilingual (EN/ES) HTML report, aligned to GSBPM sub-process 5.6 and the ESS quality concepts, that reads like an official quality report rather than a dump of numbers. No graphics device, no server, no JavaScript. In a single call it assembles:
- an executive narrative: the cascade explained in prose, the headline design effect and effective n, a truthful status checklist and a completion line;
- a reference-metadata header (operation, reference period, producer, frame, source and date of the control totals);
- AAPOR fieldwork outcome rates: the full case disposition and the response rate in three variants (RR1 ≤ RR3 ≤ RR5), unweighted and base-weighted;
-
per-domain reliability (
domains =): active n, sum of weights, CV, Kish design effect and effective n within each domain or crossing; - the replication design (
replicates =): method, replicates, strata, PSUs, lonely-PSU handling, seed, cores and run time; - a per-step impact table (each step’s change in deff and CV), the weight distribution, per-step visuals, and a points-of-attention panel.
report_weighting(fitted, lang = "es",
                 domains    = ~ region + region:sex,   # per-domain reliability card
                 replicates = boot,                     # the replication-design card
                 metadata   = list(survey = "Encuesta de Hogares",
                                   reference_period = "2024"))
See the Quality report article for a full example.
Panels: measuring change, not just levels
A continuous survey measures the same units more than once. The overlap is what makes the change between two periods more precise than either level – part of the sampling error cancels – and it is also what makes the change harder to estimate, because the two samples are not independent:
V(theta_t - theta_{t-1}) = V(theta_t) + V(theta_{t-1}) - 2 Cov(theta_t, theta_{t-1})That covariance is not a design constant you can look up. It has to be produced, by drawing the replicates so that a PSU present in both periods is resampled the same way in both. That is what the panel layer does.
The structure first. panel_design() reads the unit x wave crossing and describes what is actually there. The declared rotation pattern ("6" for the Canadian LFS or Uruguay’s ECH, "4-8-4" for the US CPS, "2-(2)-2" for Chile’s ENE, "1(2)5" for PNAD Continua) is verification, not configuration: when the observed overlap falls short of what the calendar implies, the linkage key is suspect and the alert says so.
pd <- panel_design(panel_ine, unit = c("household_id", "person_no"),
                   wave = "wave", rotation_group = "rotation_group", pattern = "6")
Net change with an honest variance. wave_bootstrap() (or wave_jackknife()) coordinates the replicates across waves; change_mean() / change_total() report the change with its standard error, the correlation the overlap induces, and deff_change – the ratio to what an office would publish if it treated the two periods as independent. level_mean() / level_total() give the levels, panel_mean() / panel_total() any linear combination (a rolling quarter, an annual average), and change_estimate(), level_estimate() and panel_estimate() take an arbitrary statistic.
wb <- wave_bootstrap(list(T1 = rec1, T2 = rec2), replicates = 500,
                     strata = "stratum", psu = "psu", seed = 1)
change_mean(wb, "unemployed")
Chained production. An office publishes month t weeks before month t+1 exists, so wave_bootstrap()’s “all waves at once” is not how production runs. wave_step() processes one period and writes a small carry; the next period reads it and nothing else. wave_contrast() estimates any combination straight from the saved carries, without the waves being in memory.
s2 <- wave_step(rec2, previous = readRDS("carry/2026-01.rds"), estimands = EST,
                strata = "stratum", psu = "psu", period = "2026-02", seed = 2)
s2$weights                                   # cross-sectional weights, untouched
s2$change                                    # the net change against 2026-01
s2$strata                                    # coordination diagnostic, per stratum
saveRDS(wave_carry(s2), "carry/2026-02.rds") # all the next period needs
Composite estimation. step_cre() implements regression composite estimation (Fuller & Rao 2001; Gambino, Kennedy & Singh 2001; INE Uruguay’s ECH, sec. 8.4): the calibration targets the known demographic totals and composite totals estimated from the previous wave, which is what buys the large variance reduction on changes. Because the second block is estimated, replicate b of period t rebuilds it from replicate b of period t-1.
Longitudinal weights and gross flows. A net change cannot tell an immobile population from one where equal numbers enter and leave employment. For that, panel_merge() builds the wide file, step_attrition() adjusts for the units lost along the way (propensity or response-homogeneity groups), and step_drop_ineligible() removes those who left the universe – leaving the target population is not nonresponse. Then transition_matrix(), boot_transition() and boot_flows() give the flows, with standard errors that include the cost of having estimated the adjustments.
wide <- panel_merge(waves, by = c("household_id", "person_no"), require = "all")
lw <- weighting_spec(wide, base_weights = pw_T1) |>
  step_drop_ineligible(disposition_T4 == "OS") |>
  step_unknown_eligibility(disposition_T4 == "UNK", by = "region_T1") |>
  step_attrition(respondent = responded_always, method = "propensity",
                 formula = ~ age_T1 + sex_T1) |>
  prep()
transition_matrix(lw, from = "lf_status_T1", to = "lf_status_T4", format = "row")
A declarative estimation grammar. Once a panel object exists, estimates are piped rather than looped: step_domain() splits, step_filter() masks a subpopulation (rows are masked, not dropped, so the design is preserved), step_estimate() names the statistic and whether it is wanted as a level or a change, step_transition() asks for a flow table instead, and collect_estimates() evaluates the whole thing into one tidy frame.
wb |> step_domain(region) |>
  step_estimate(mean(unemployed), over = "change") |>
  collect_estimates()
A panel quality report. report_panel() writes the panel analogue of report_weighting(): the rotation structure and the observed-vs-implied overlap, the attrition cascade, the coordination diagnostic per stratum, the changes with their rho and deff_change, and the flows.
Four articles cover this layer: Rotating panels (the entry point), Coordinated replication (what travels between waves and how to read the $strata diagnostic), Composite estimation (step_cre() in full, with the equations), and Pure panels (attrition over many waves, the longitudinal weight and gross flows). Validation against survey and ReGenesees checks the change variance against the analytic estimator of Berger & Priam (2016).
What it does
Adjustment steps, applied in the order you pipe them:
| Step | What it does |
|---|---|
step_unknown_eligibility() |
Redistribute unknown-eligibility cases among the known ones (person- or household-level via cluster). |
step_drop_ineligible() |
Zero out out-of-scope units: the weight is discarded, not redistributed. An optional reason is carried into the report. |
step_select_within() |
Within-cluster selection: unequal prob, or simple random selection of n_selected (default 1) out of n_eligible. The cluster need not be a household, and in a multi-stage design the step can appear more than once, each occurrence undoing one stage of subsampling. |
step_subsample() |
Second-phase subsampling (two-phase / double sampling), with its own variance component. |
step_nonresponse() |
Weighting classes, response-propensity (logit / CART / random forest / xgboost, optional k-fold cross-fitting, weighted or unweighted model), or two-phase calibration; person- or household-level (cluster). |
step_pseudoweight() |
Non-probability samples: participation propensity against a probability reference, turned into a pseudo-weight. |
step_calibrate() |
Raking, post-stratification, linear/GREG; bounded (Deville-Särndal), integrative (equal_within_cluster: one weight per household), ridge (penalized) and domain (by) options. Totals can be a tidy data frame, or the design-weighted totals of a reference_sample() instead of a frame. |
step_model_calibration() |
Wu-Sitter model calibration with working models for the outcomes (any engine, with cross-fitting). |
step_trim() |
Trim by a ratio to the base weight, the median or a fixed value (reference), with a floor as well as a cap, per subgroup (by) and with the trimmed mass redistributed. |
step_trim_weights() |
Trim to an absolute band, with the cutoff chosen automatically: Tukey far-out fence or Potter’s MSE-optimal threshold; proportional or uniform redistribution. |
step_trim_calibrated() |
Trimmed (range-restricted) calibration: bound the weights into [lower, upper] while preserving the calibration totals (Folsom-Singh), with per-subgroup bounds and an integrative option. |
step_round() |
Round the weights, including controlled rounding: "preserve_total" keeps the sum, "balanced" randomizes so the expectation is preserved; per subgroup with by. |
step_rescale() |
Rescale to the active sample size or to a given total, overall or within by. |
step_assert() |
Quality checkpoint on deff, weight ratio or effective n; stops the recipe (on_fail = "error") or records an alert and continues. |
step_nr_sensitivity() |
Diagnostic (changes no weight): proxy pattern-mixture ignorance interval for nonignorable nonresponse or selection. |
Panel steps, for a recipe that weights one wave of a panel or a longitudinal file:
| Step | What it does |
|---|---|
step_panel_overlap() |
Adjust the base weights by the panel-selection probability of the wave combination (ECLAC ch. XVI); panel_pr() computes it from the design. |
step_attrition() |
Attrition adjustment over waves: individual propensity (1/phi) or response-homogeneity groups. |
step_cre() |
Composite regression estimation: calibrate to the known totals and to composite totals estimated from the previous wave. |
step_cross_sectional(), step_longitudinal()
|
Declare the scope of the recipe, which is what decides whether the panel-specific guards apply. |
Eligibility and response accept 0/1 dummy columns or any logical condition.
Diagnostics and reporting: summary() and plot() show the per-stage cascade with the Kish design effect (deff = 1 + CV^2) and effective sample size; weight_factors() returns the per-unit, per-step factors. For programmatic quality control, weighting_alerts() / has_alerts(), collect_step_detail(), collect_propensities() and domain_summary() read the recipe back step by step and domain by domain (see the Inspecting and auditing the cascade article). And report_weighting() writes a self-contained, bilingual (EN/ES) HTML quality report, aligned to GSBPM 5.6 and the ESS quality concepts, with no graphics device or server required: an auto-generated methodological narrative, a reference-metadata header, AAPOR fieldwork outcome rates (RR1/RR3/RR5), per-domain reliability, the replication design, a per-step impact table, weight-distribution diagnostics, per-step visuals and a points-of-attention panel.
Variance estimation (see the Variance estimation article). Once the weights are built, get design-based standard errors with a bootstrap that re-runs the whole recipe on each replicate:
boot <- bootstrap_weights(recipe, replicates = 500, strata = "region", psu = "psu",
                          lonely_psu = "collapse", cores = 4)   # collapse + parallel
boot_mean(boot, "income")                       # estimate, SE and 95% CI
boot_total(boot, "employed")                    # totals; jack_mean() / jack_total()
bootstrap_estimate(boot, f)                     # any statistic; jackknife_estimate()
design_effect(collect_weights(fitted)$.weight)  # Kish deff and n_eff

# hand the replicate weights to survey / srvyr for the rest of the analysis
rep_design <- as_svrepdesign(boot)              # a svyrep.design object
as_svydesign(fitted, ids = ~ psu, strata = ~ region)   # or the plain design
collect_replicate_weights(boot)                 # replicate weights as a data.frame
The bootstrap resamples PSUs within strata (Rao-Wu rescaling) and then re-applies the entire cascade (eligibility, nonresponse, calibration, trimming) on each replicate. So the replicate weights carry two sources of variability at once: the sampling design (the resampling of PSUs within strata) and every weighting adjustment (each one is re-estimated on each replicate). Re-running the full recipe per replicate is automatic here, rather than something you re-orchestrate by hand on top of the replicate weights, and the result plugs straight into survey/srvyr through as_svrepdesign() for any downstream estimator.
Across waves, wave_bootstrap() and wave_jackknife() do the same thing with the replicates coordinated, and wave_step() does it one period at a time. two_phase_variance() decomposes a two-phase design into V = V1 + V2.
Example data
Three cross-sectional datasets: population (the frame), sample_survey (take-all roster) and sample_one (multistage select-one design), all with stratum, PSU and design weight, so the full pipeline and the variance methods run natively.
Four panel datasets in long format, sharing one structure and differing only in the rotation system, so the same code runs on each: panel_puro (a pure panel, four waves), panel_ine (6 in-out, Uruguay’s ECH and the Canadian LFS), panel_cl (2-(2)-2, Chile’s ENE) and panel_us (4-8-4, the US CPS). They carry a persistent household and person key, stratum and PSU, the four-state between-wave disposition (R / NR / OS / UNK) and labour-status variables, so attrition, coordinated replication, composite estimation and gross flows all run on package data.
Extending
apply_step() is the internal S3 generic behind each step. To add an adjustment, define a step_*() constructor (inert) and its apply_step.<class>() method; nothing else changes.
References
General framework
- Valliant, R., Dever, J. A., & Kreuter, F. (2018). Practical Tools for Designing and Weighting Survey Samples (2nd ed.). Springer.
- Sarndal, C.-E., Swensson, B., & Wretman, J. (1992). Model Assisted Survey Sampling. Springer.
Nonresponse and machine-learning propensities
- Sarndal, C.-E., & Lundstrom, S. (2005). Estimation in Surveys with Nonresponse. Wiley.
- Little, R. J. A. (1986). Survey nonresponse adjustments for estimates of means. International Statistical Review, 54(2), 139–157.
- Breidt, F. J., & Opsomer, J. D. (2017). Model-assisted survey estimation with modern prediction techniques. Statistical Science, 32(2), 190–205.
- Chernozhukov, V., et al. (2018). Double/debiased machine learning for treatment and structural parameters. The Econometrics Journal, 21(1), C1–C68. (cross-fitting).
- Andridge, R. R., & Little, R. J. A. (2011). Proxy pattern-mixture analysis for survey nonresponse. Journal of Official Statistics, 27(2), 153–180. (sensitivity to nonignorable nonresponse).
Non-probability samples
- Elliott, M. R., & Valliant, R. (2017). Inference for non-probability samples. Statistical Science, 32(2), 249–264. (pseudo-weights).
- Meng, X.-L. (2018). Statistical paradises and paradoxes in big data (I). Annals of Applied Statistics, 12(2), 685–726. (data-defect index).
Calibration
- Deville, J.-C., & Sarndal, C.-E. (1992). Calibration estimators in survey sampling. JASA, 87(418), 376–382.
- Deville, J.-C., Sarndal, C.-E., & Sautory, O. (1993). Generalized raking procedures in survey sampling. JASA, 88(423), 1013–1020.
- Deming, W. E., & Stephan, F. F. (1940). On a least squares adjustment of a sampled frequency table. Annals of Mathematical Statistics, 11(4), 427–444.
- Lemaitre, G., & Dufour, J. (1987). An integrated method for weighting persons and families. Survey Methodology, 13(2), 199–207.
- Wu, C., & Sitter, R. R. (2001). A model-calibration approach to using complete auxiliary information from survey data. JASA, 96(453), 185–193.
- Bardsley, P., & Chambers, R. L. (1984). Multipurpose estimation from unbalanced samples. Applied Statistics, 33(3), 290–299. (ridge calibration).
- Folsom, R. E., & Singh, A. C. (2000). The generalized exponential model for sampling weight calibration for extreme values, nonresponse, and poststratification. Proc. ASA Survey Research Methods Section, 598–603. (trimmed calibration).
Design effect and trimming
- Kish, L. (1965). Survey Sampling. Wiley; and Kish, L. (1992). Weighting for unequal Pi. Journal of Official Statistics, 8(2), 183–200.
- Potter, F. J. (1990). A study of procedures to identify and trim extreme sample weights. Proc. ASA Survey Research Methods Section, 225–230.
- Potter, F., & Zheng, Y. (2015). Methods and issues in trimming extreme weights in sample surveys. Proc. ASA Survey Research Methods Section.
Variance estimation
- Rao, J. N. K., & Wu, C. F. J. (1988). Resampling inference with complex survey data. JASA, 83(401), 231–241.
- Rao, J. N. K., Wu, C. F. J., & Yue, K. (1992). Some recent work on resampling methods for complex surveys. Survey Methodology, 18(2), 209–217.
- Preston, J. (2009). Rescaled bootstrap for stratified multistage sampling. Survey Methodology, 35(2), 227–234.
- Wolter, K. M. (2007). Introduction to Variance Estimation (2nd ed.). Springer.
- Lumley, T. (2010). Complex Surveys: A Guide to Analysis Using R. Wiley.
Panels, change and composite estimation
- Berger, Y. G., & Priam, R. (2016). A simple variance estimator of change for rotating repeated surveys. Journal of the Royal Statistical Society A, 179(1), 251–272.
- Statistics Canada (2008). Methodology of the Canadian Labour Force Survey, cat. 71-526-X, sec. 7.2.2. (coordinated replication for rotating panels).
- Fuller, W. A., & Rao, J. N. K. (2001). A regression composite estimator with application to the Canadian Labour Force Survey. Survey Methodology, 27(1), 45–51.
- Gambino, J., Kennedy, B., & Singh, M. P. (2001). Regression composite estimation for the Canadian Labour Force Survey. Survey Methodology, 27(1), 65–74.
- CEPAL / ECLAC (2023). Diseño y análisis estadístico de las encuestas de hogares de América Latina, LC/PUB.2023/14-P, Santiago, ch. XVI–XVII. (longitudinal weights and gross flows).
Citation
If you use weightflow in published work, please cite:
Ferreira, J. P. (2026). Weightflow: Reproducible, recipe-aware survey weighting for official statistics in R. Statistical Journal of the IAOS. Advance online publication. https://doi.org/10.1177/18747655261484262
citation("weightflow") returns the same reference as BibTeX.